Bibliometrix is a powerful tool that can be used to answer a wide variety of research questions, such as:
- What are the most cited papers in a particular field?
- Who are the most influential authors in a particular field?
- How has the research landscape in a particular field changed over time?
- What are the most important research topics in a particular field?
- How are different research topics connected?
- How does research collaboration occur in a particular field?
There are two types of interface of the bibliometrix:-
- Command-line interface
- User can type the command for performing the bibliometric analysis
- Users to have some knowledge of R programming.
- More control over the analysis
- Graphical-user Interface (biblioshiny)
- User can perform bibliometric analysis by clicking of the button on the interface
- Any body can perform the analysis without having the knowledge of R programming
- Easier to share results
It is an open-source quantitative research package tool for scientometric and bibliometric analysis of scientific publications and their citations to find the trends and patterns of scientific development over time. Its is develop by Massimo Aria and Corrado Cuccurullo.
This tool is built on R, a statistical computing and graphics programming language. It can collect, preprocess, analyse, and visualise the data downloaded from various bibliographical databases, such as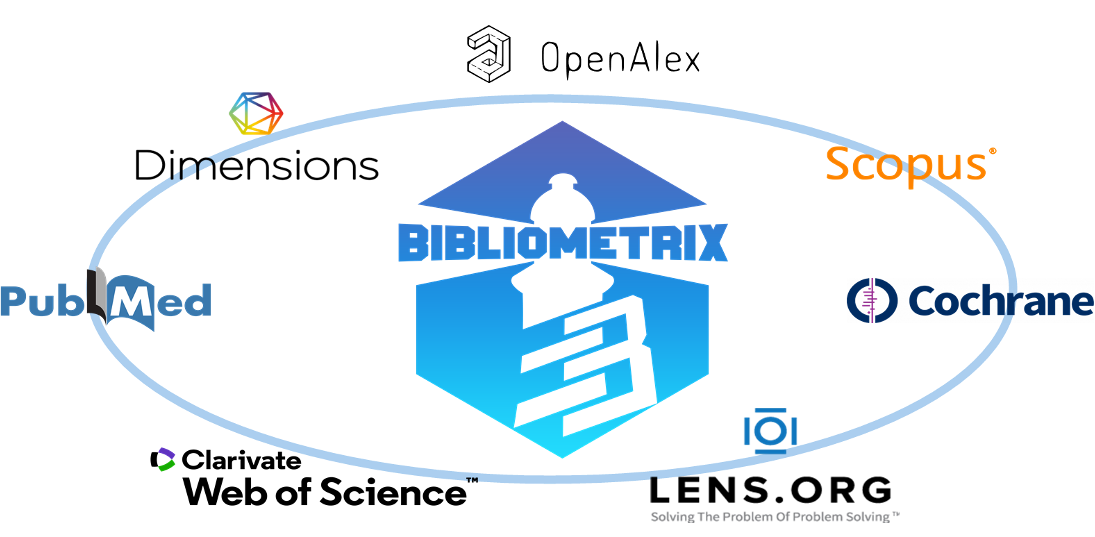
Bibliometrix is a command-line tool that provides a broader range of features but requires some programming skills and command knowledge. Biblioshiny is a more user-friendly interface based on the bibliometrix package, making it possible to perform bibliometric analysis without any programming knowledge.
- Co-citation analysis: This method identifies clusters of highly cited documents and can be used to identify emerging research areas and track the evolution of a field over time.
- Bibliographic coupling analysis: This method identifies pairs of documents that share a large number of common references and can be used to identify related research topics and collaboration networks.
- Co-authorship analysis: This method identifies pairs of authors who have co-authored documents and can be used to identify collaboration networks and emerging research groups.
- Co-word analysis: This method identifies pairs of words that frequently occur together in documents and can be used to identify conceptual structures and emerging research topics.
- Network analysis: This method can be used to analyze bibliometric networks to identify the most important nodes, clusters of nodes, and relationships between nodes.
- Topic modeling: This method can be used to identify the main topics of a corpus of documents.
- Data mining: This method can be used to extract patterns from bibliometric data.
Bibliometrix also provides a variety of functions for visualizing bibliometric data. For example, it can be used to create:
- Co-citation maps: These maps show the relationships between highly cited documents.
- Bibliographic coupling maps: These maps show the relationships between documents that share a large number of common references.
- Co-authorship maps: These maps show the relationships between authors who have co-authored documents.
- Co-word maps: These maps show the relationships between words that frequently occur together in documents.
Bibliometrix can be used by researchers from a wide range of disciplines, including:
- Scientists and academicians: Bibliometrix can be used to identify emerging research areas, track the evolution of a field over time, and identify potential research collaborators.
- Librarians and information scientists: Bibliometrix can be used to identify the most influential publications in a field, assess the impact of research, and develop collections that meet the needs of users.
- Funding agencies and policymakers: Bibliometrix can be used to identify research areas that are ripe for new investment, evaluate the performance of research institutions, and track the impact of research on society.
- It is free and open-source.
- It can be used by researchers with no prior programming experience
- Easily integrate with other R packages and functions for data manipulation and visualization
- It has a web-based interface called biblioshinny that helps non-coder background people to use this tool.
- It has a rich set of techniques and features that can cover the whole process of bibliometric analysis
Bibliometrix offers the following features and techniques:-
- Data collection: It can process data file that are collected/downloaded from various sources such as Web of Science, Scopus, OpenAlex, Cochrane, Lens.org, Pubmed and Dimensions
- Data preprocessing: It can clean and standardise the data and merge the split data by different criteria such as year, type source, etc..
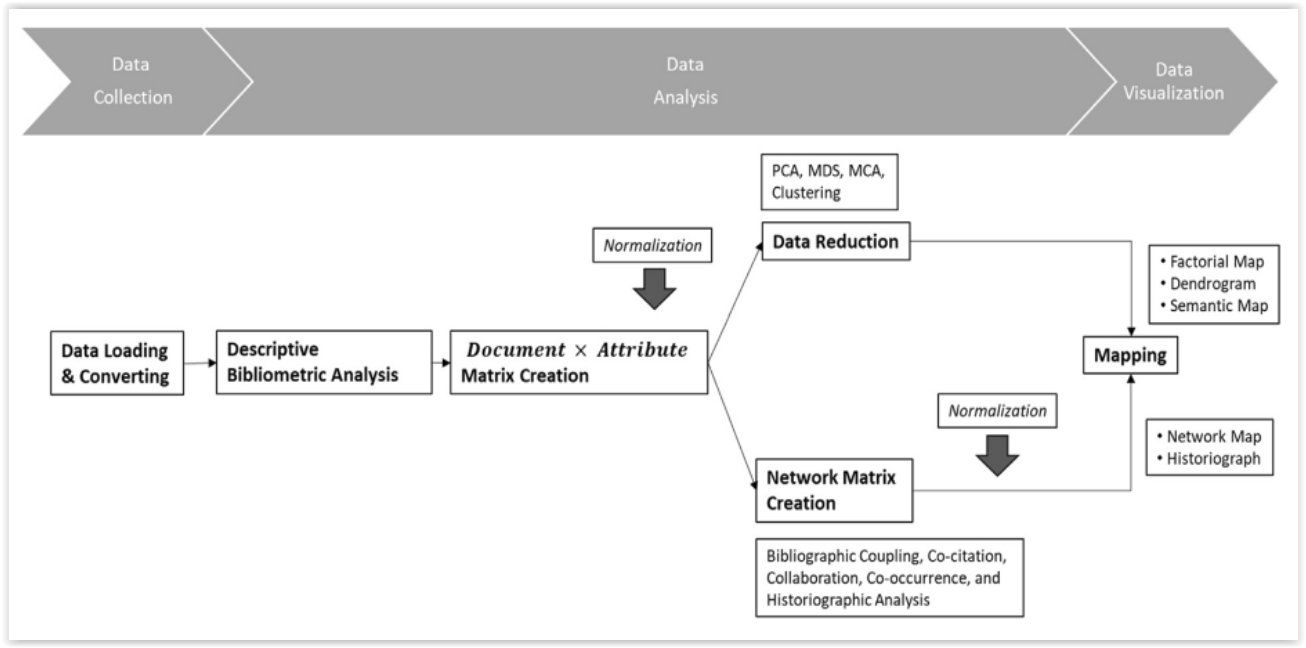
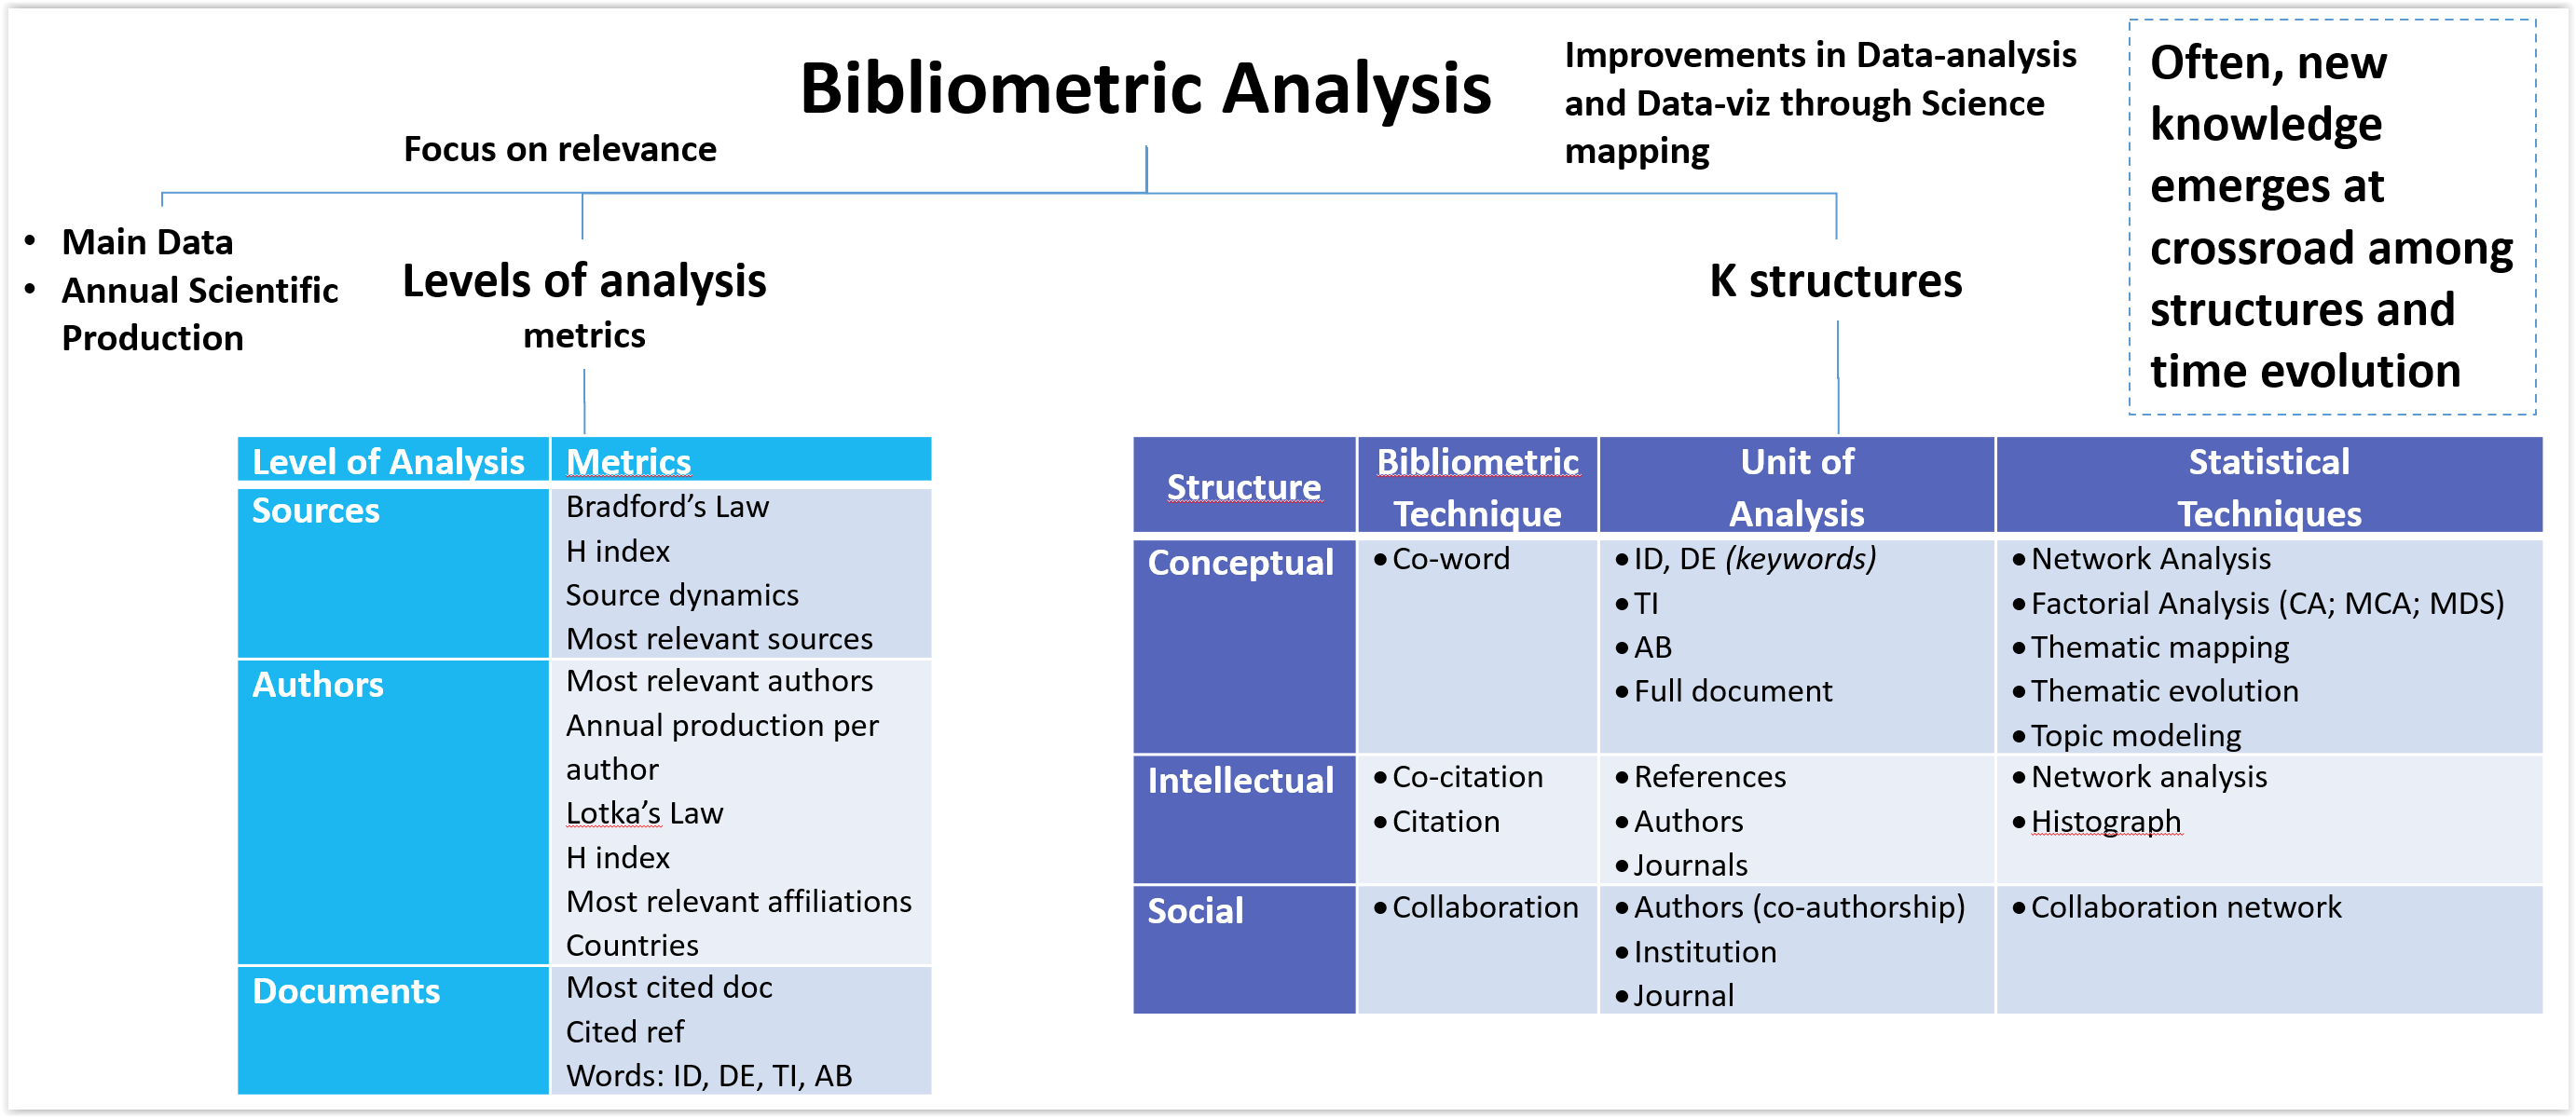
- Data analysis: It can perform various types of analysis, such as descriptive statistics, co-citation analysis, co-authorship analysis, bibliographic coupling analysis, co-word analysis, and cluster analysis. It can also calculate various bibliometric indicators, such as h-index, g-index, citations per paper, and impact factor.
- Data visualisation: It can generate various types of maps and graphs to show the trends and patterns in the data, such as co-citation clusters, co-word networks, timeline view, historiograph view, thematic map evolution, and reference publication year spectroscopy. It can also export the maps and graphs in different formats, such as PNG, PDF, HTML, and SVG.
Bibliometrix supports the following file formats:
- Web of Science: Plain text (.txt), EndNote Desktop (.ciw), and BibTeX (.bib)
- Scopus: BibTeX (.bib) or CSV (.csv)
- Pubmed: API call
- Cochrane Library: Plain text (.txt) and CSV (.csv)
- OpenAlex: BibTeX (.bib) and CSV (.csv)
- Dimensions: API call, CSV (.csv), and Excel (.xlsx)
- Lens.org: CSV (.csv)
Now visit the RStudio downloads page to grab the latest release of RStudio for Debian based Linux distributions.
sudo wget https://download1.rstudio.org/electron/jammy/amd64/rstudio-2023.06.2-561-amd64.deb
sudo apt install -f ./rstudio-2023.06.2-561-amd64.deb
If on Ubuntu 22.04 you experience issues while trying to start the application. First install openssl 1.1 like below.
Once done launch Rstudio without sandbox
sudo wget http://security.ubuntu.com/ubuntu/pool/main/o/openssl/libssl1.1_1.1.1l-1ubuntu1.2_amd64.deb
sudo apt-get install ./libssl1.1_1.1.1l-1ubuntu1.2_amd64.deb
Once done launch Rstudio without sandbox
rstudio --no-sandbox
Download and install the most recent version of R from (https://cran.r-project.org/)
Download and install the most recent version of Rstudio from (https://posit.co/download/rstudio-desktop/)
You can obtain the data from the databases mentioned below by querying/searching using various criteria, including topic, author, journal, title, citation, references, timespan, and more.
This example shows how to download data, by querying a term on Scopus in the search within "Article title, Abstract, Keywords" fields.
We choose the generic term “bibliometrics”. Write the keyword “bibliometrics” in the search field and select search within "Article title, Abstract, Keywords" fields. (see figure 1).


