- To identify the most important researchers, journals, and topics in a field.
- To track the evolution of a field over time.
- To identify emerging trends and new areas of research.
- To benchmark our research against other researchers in our field.
- To create visually appealing and informative maps that can be used to communicate our research findings to others.
Network layout and clustering
VOSviewer uses advanced layout and clustering techniques to visualize and analyze bibliometric networks. The layout algorithms are designed to minimize edge crossings and produce maps that are easy to read. The clustering algorithms group similar items together, which can be useful for identifying different research areas in a field.
Natural language processing
VOSviewer uses natural language processing techniques to create term co-occurrence networks based on English-language textual data. This can be useful for identifying the key topics in a field. VOSviewer can also distinguish between relevant and non-relevant terms, which can improve the accuracy of the results.
Creating bibliometric networks
VOSviewer offers a number of advanced features for creating bibliometric networks, such as co-authorship, bibliographic coupling, and co-citation networks. VOSviewer can also reduce the influence of publications with many authors, many citations, or many references using a fractional counting approach. Data cleaning can be performed using thesaurus files.
VOSviewer is a free and open-source software tool for creating and visualizing bibliometric networks. Bibliometric networks are maps of the relationships between different items in a body of scientific literature, such as publications, authors, journals, and keywords. VOSviewer can be used to visualize these networks in a variety of ways, including network visualizations, overlay visualizations, and density visualizations.
VOSviewer is a powerful tool for researchers who want to understand the structure and dynamics of scientific fields. It can be used to identify key researchers, journals, and topics in a field, as well as to track the evolution of a field over time. VOSviewer can also be used to identify emerging trends and new research areas.
VOSviewer is developed by Nees Jan van Eck and Ludo Waltman at Leiden University's Centre for Science and Technology Studies. They are both experts in the field of bibliometrics, and they have published numerous papers on the development and use of VOSviewer.
VOSviewer can import data from various sources, including bibliographic databases, citation files, and text files. This allows VOSviewer to analyse various networks, including bibliometric networks, social networks, and product networks.
- It reads data from bibliographic database files: Web of Science, Dimensions, lens, and PubMed
- It reads data from reference manager files: RIS, EndNote and RefWorks
- It downloads data through API: Crossref, OpenAlex, Europe PMC, Semantic Scholar, OCC, COCI and Wikidata.
VOSviewer can be used by anyone who wants to analyze and visualize bibliometric networks of relationships between any type of data. This includes researchers, students, librarians, and other professionals in a variety of fields, such as:
- Science and technology: VOSviewer can be used to analyze the relationships between researchers, publications, and journals in a variety of scientific and technological fields. This can be helpful for identifying key researchers, journals, and topics in a field, as well as for tracking the evolution of a field over time.
- Business and economics: VOSviewer can be used to analyze the relationships between companies, industries, and markets. This can be helpful for identifying key companies and industries, as well as for identifying emerging trends and new areas of competition.
- Medicine and health sciences: VOSviewer can be used to analyze the relationships between diseases, treatments, and genes. This can be helpful for identifying new targets for drug discovery and for developing more effective treatments.
- Social sciences and humanities: VOSviewer can be used to analyze the relationships between authors, publications, and topics in a variety of social sciences and humanities fields, such as history, sociology, and political science. This can be helpful for identifying key researchers and topics in a field, as well as for tracking the evolution of a field over time.
- It could be used to analyze the relationships between characters in a novel,
- The relationships between actors in a movie, or
- The relationships between products in a retail store
- Ease of use: VOSviewer is very easy to use, even for users with no prior experience with bibliometric analysis.
- Versatility: VOSviewer can be used to visualize and analyze a variety of different types of bibliometric networks, including networks of publications, authors, journals, and keywords.
- Power: VOSviewer is a powerful tool for identifying key researchers, journals, topics, and trends in a field.
- Customization: VOSviewer offers a high degree of customization, allowing users to create and save their own map templates and visualizations.
- Free and open-source: VOSviewer is free and open-source software, making it accessible to researchers all over the world.
- The ability to handle large maps: VOSviewer can easily handle maps that contain thousands or even tens of thousands of items.
- A variety of map types: VOSviewer offers a variety of map types, including network visualizations, overlay visualizations, and density visualizations.
- A variety of analysis tools: VOSviewer offers a variety of analysis tools, including cluster analysis, keyword analysis, and citation analysis.
- The ability to export maps and data: VOSviewer allows users to export maps and data in a variety of formats, including PDF, PNG, and CSV.
- Go to the VOSviewer website at www.vosviewer.com.
- Click on the "Download" tab in the top menu.
- Under the "Download VOSviewer" section, click on the download link for the latest version of VOSviewer for Microsoft Windows systems.
- Save the downloaded file to your computer.
- Once the download is complete, locate the downloaded file, extract the zip file and double/single-click on the .exe file to start the installation process.
- Follow the on-screen instructions to install VOSviewer on your Windows computer.
- Go to the VOSviewer website at www.vosviewer.com.
- Click on the "Download" tab in the top menu.
- Under the "macOS" section, click on the download link for the latest version of VOSviewer for macOS systems.
- Save the downloaded file to your computer.
- Once the download is complete, locate the downloaded file (usually in the "Downloads" folder) and double/sinlge-click on it to open it.
- Drag and drop the VOSviewer application icon into the "Applications" folder to install VOSviewer on your macOS computer.
- Go to the VOSviewer website at www.vosviewer.com.
- Click on the "Download" tab in the top menu.
- Under the "Linux" section, click on the download link for the latest version of VOSviewer.
- Save the downloaded file to your computer.
- Open a terminal and navigate to the directory where the downloaded file is located.
- Run the following command to make the downloaded file executable: `chmod +x VOSviewer.jar`
- Run the following command to start VOSviewer: `java -jar VOSviewer.jar`
You can obtain the data from the databases mentioned below by querying/searching using various criteria, including topic, author, journal, title, citation, references, timespan, and more.
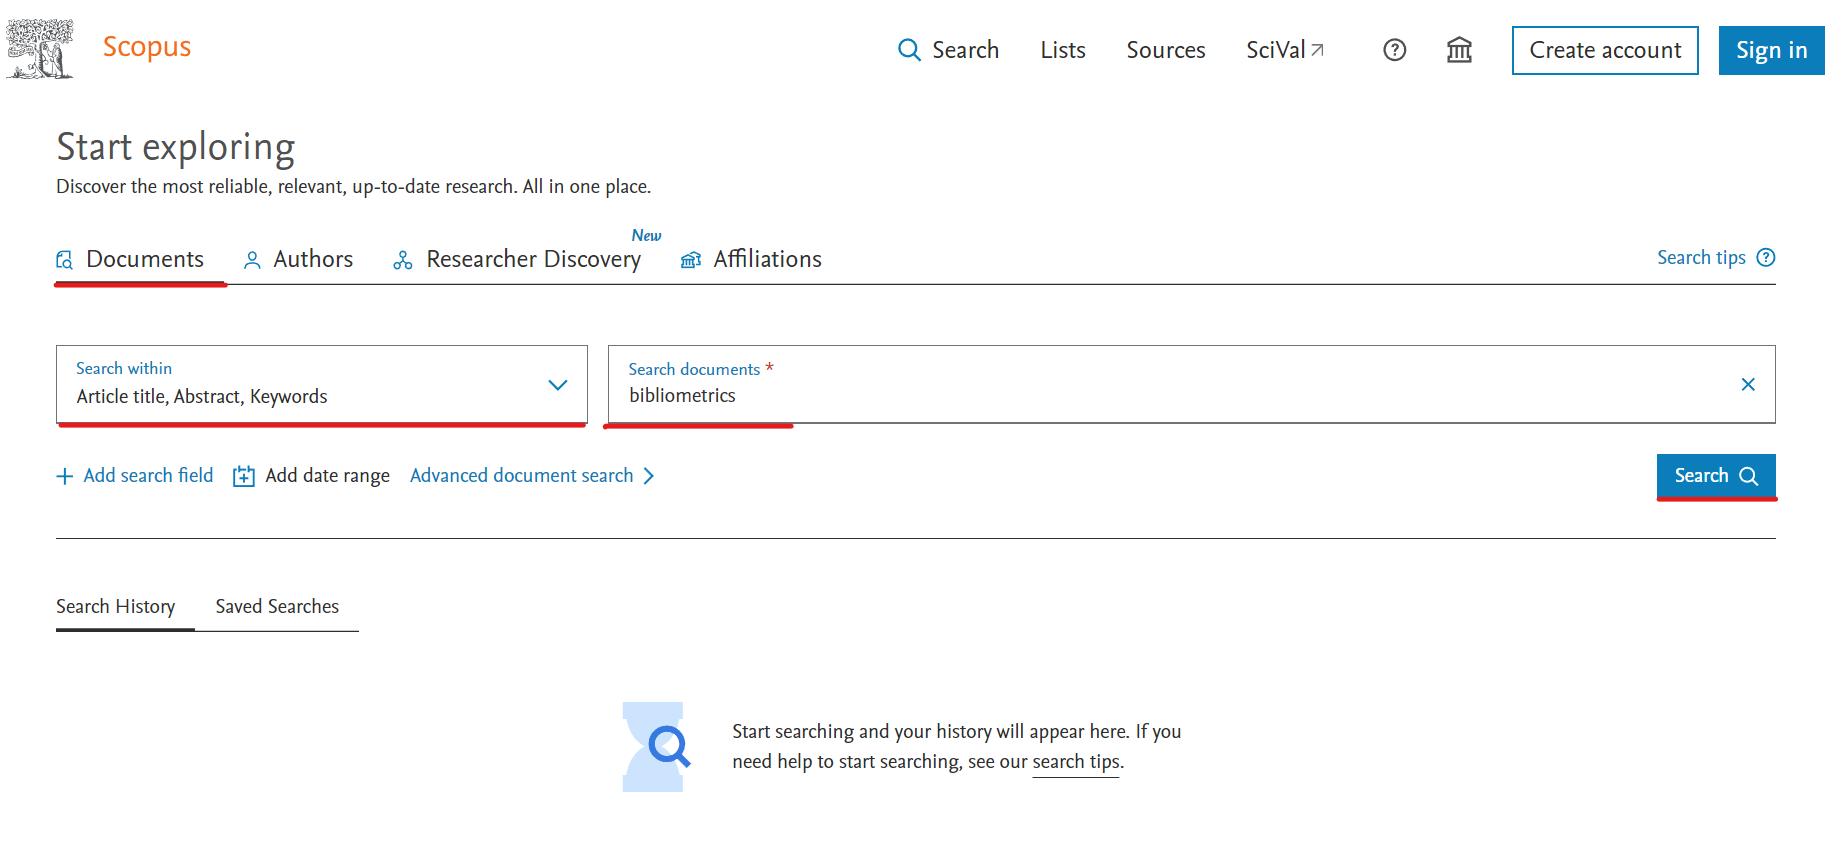
This example shows how to download data, by querying a term on Scopus in the search within "Article title, Abstract, Keywords" fields.
We choose the generic term “bibliometrics”. Write the keyword “bibliometrics” in the search field and select search within "Article title, Abstract, Keywords" fields. (see figure 1).
VOSviewer gives us three types of data to create a map:
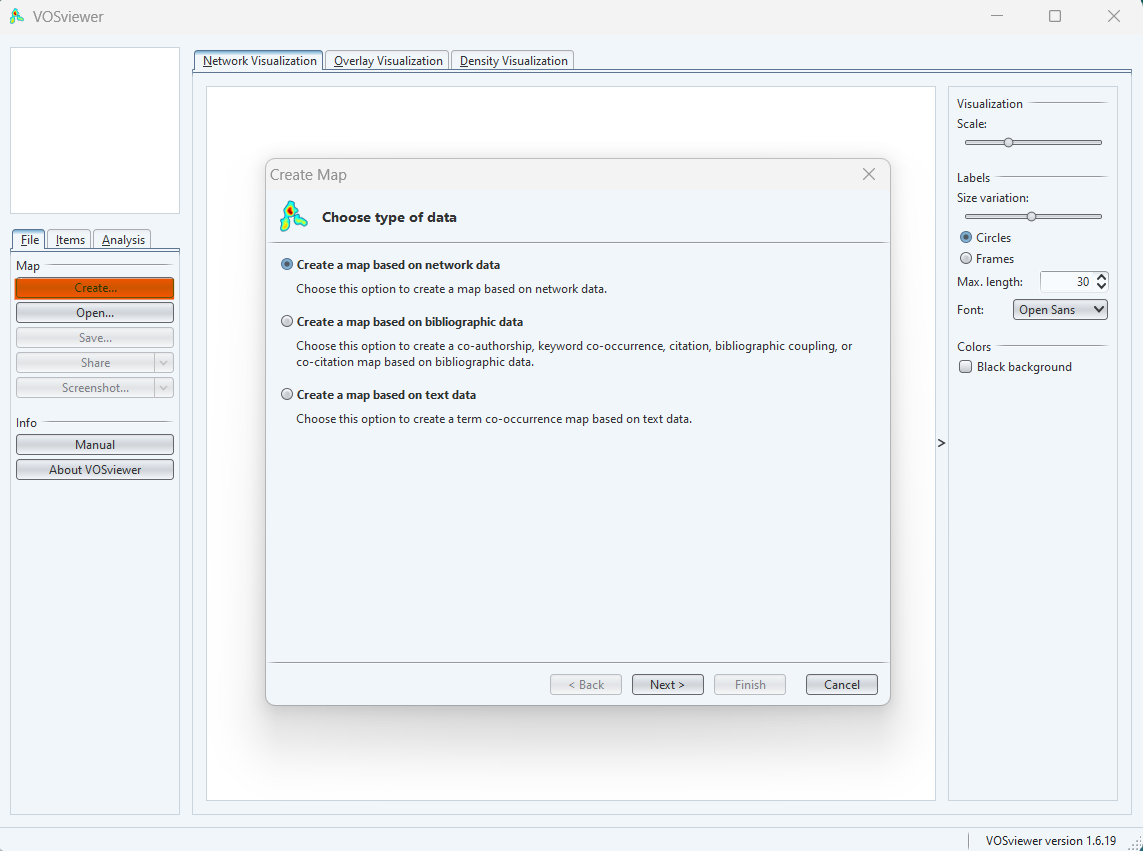
- Network data: this option is used to create a map based on network data
- Bibliographical data: this option is to used to create a co-authorship, keywords co-occurrence, citation, bibliographic coupling or co-citation map
- Text data: this option is to used to create a term co-occurrence map based on text data
VOSviewer allows us to read and download the data in three different ways:
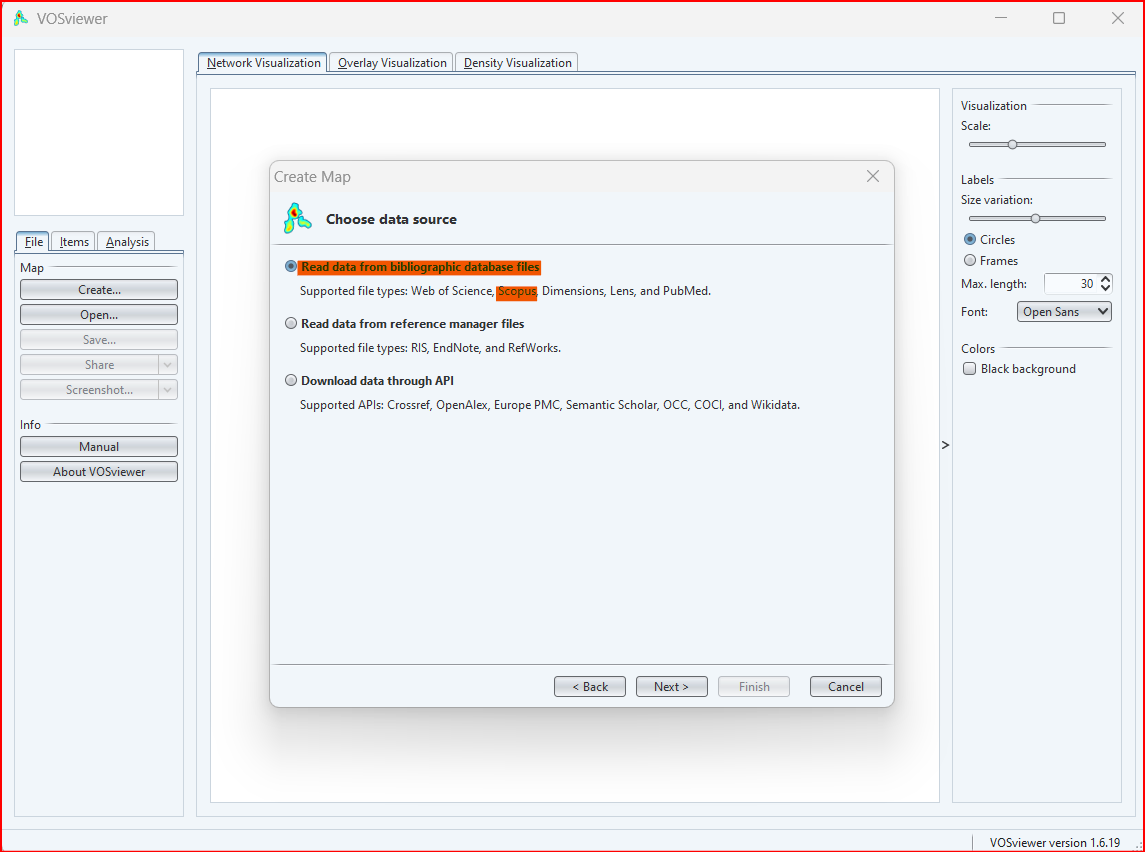
- It reads data from bibliographic database files: Web of Science, Dimensions, lens, and PubMed.
- It reads data from reference manager files: RIS, EndNote and RefWorks
- It downloads data through API: Crossref, OpenAlex, Europe PMC, Semantic Scholar, OCC, COCI and Wikidata.
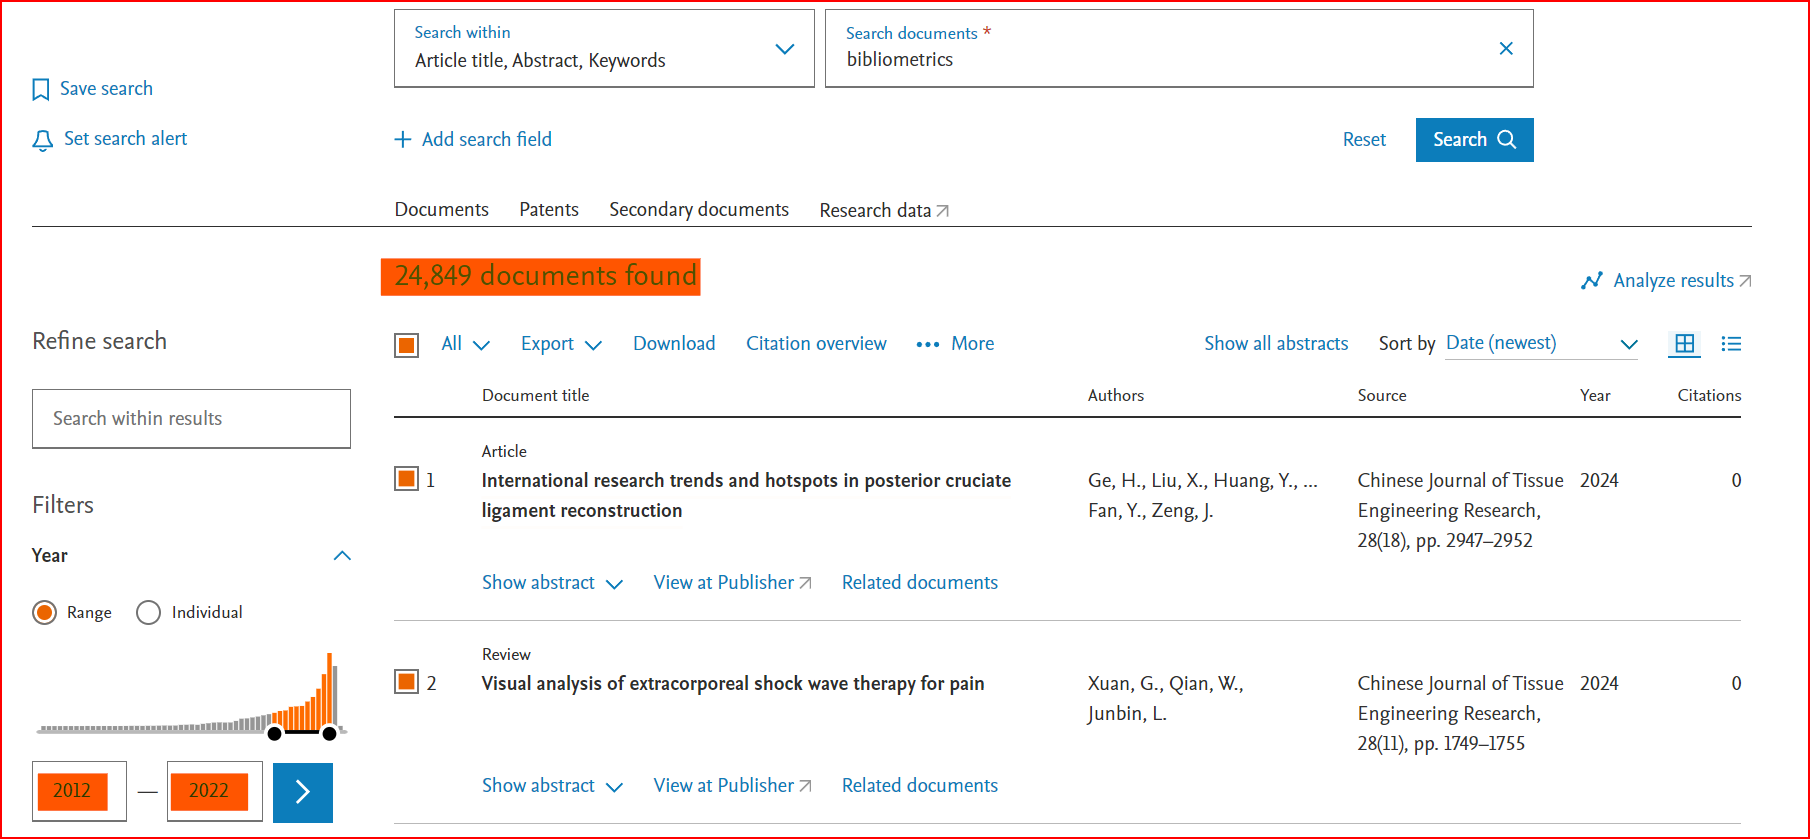
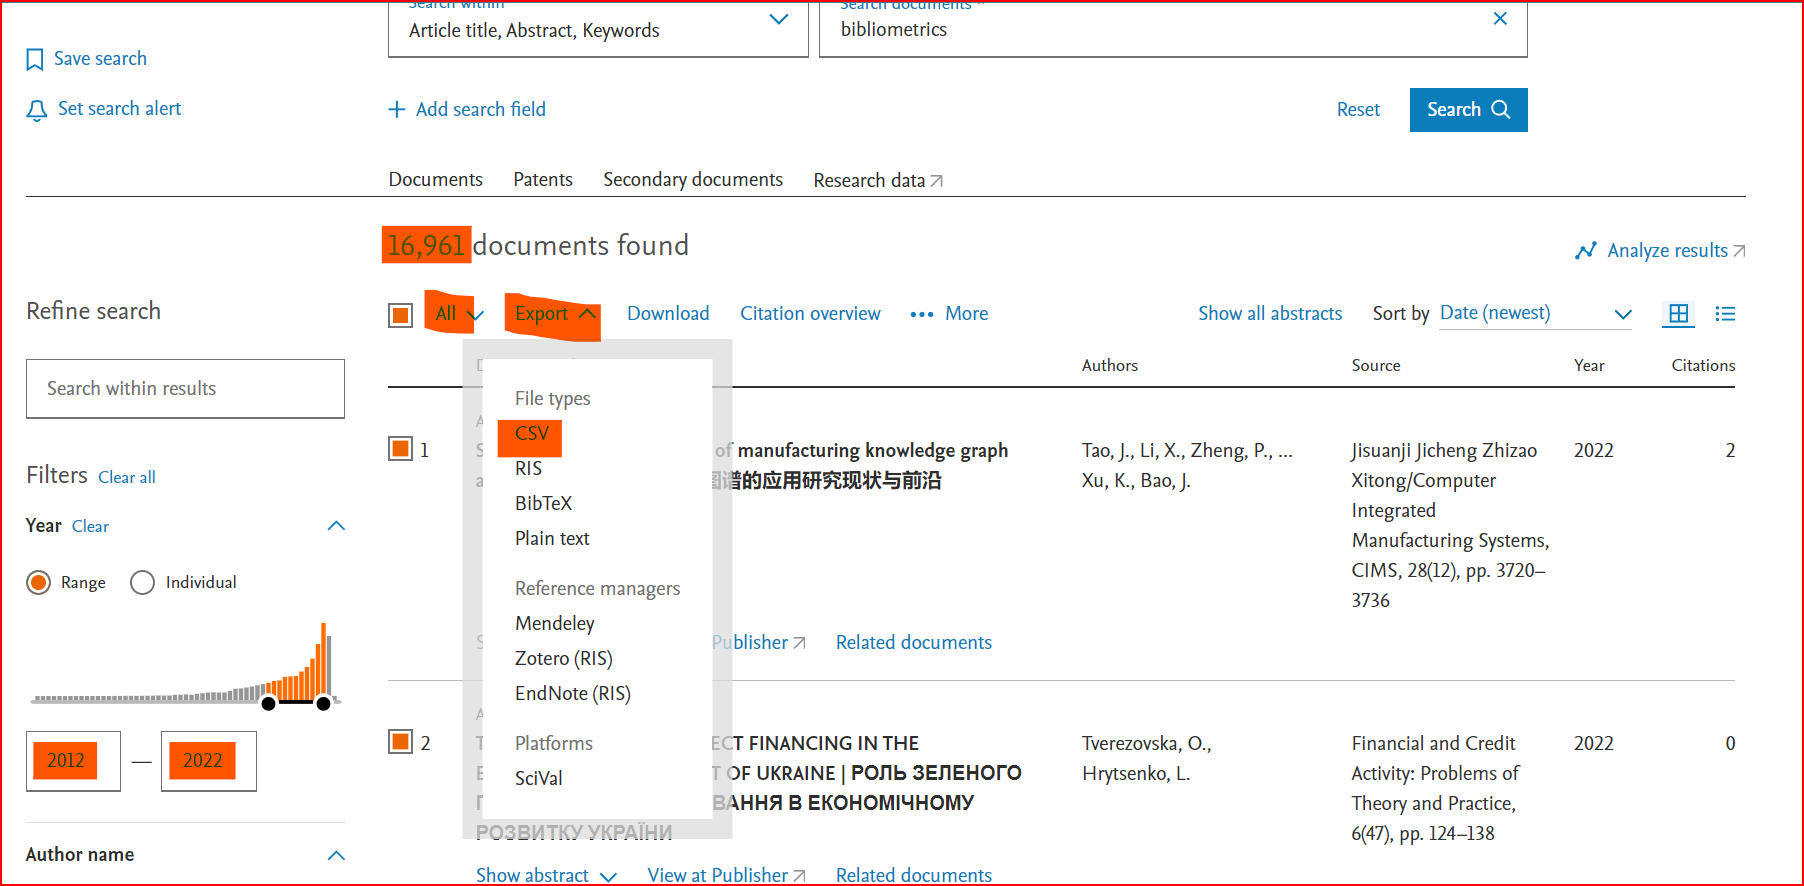
In this step you can choose the file type based on the bibliographical database files:
File format is supported in VOSviewer from the different bibliographical databases:-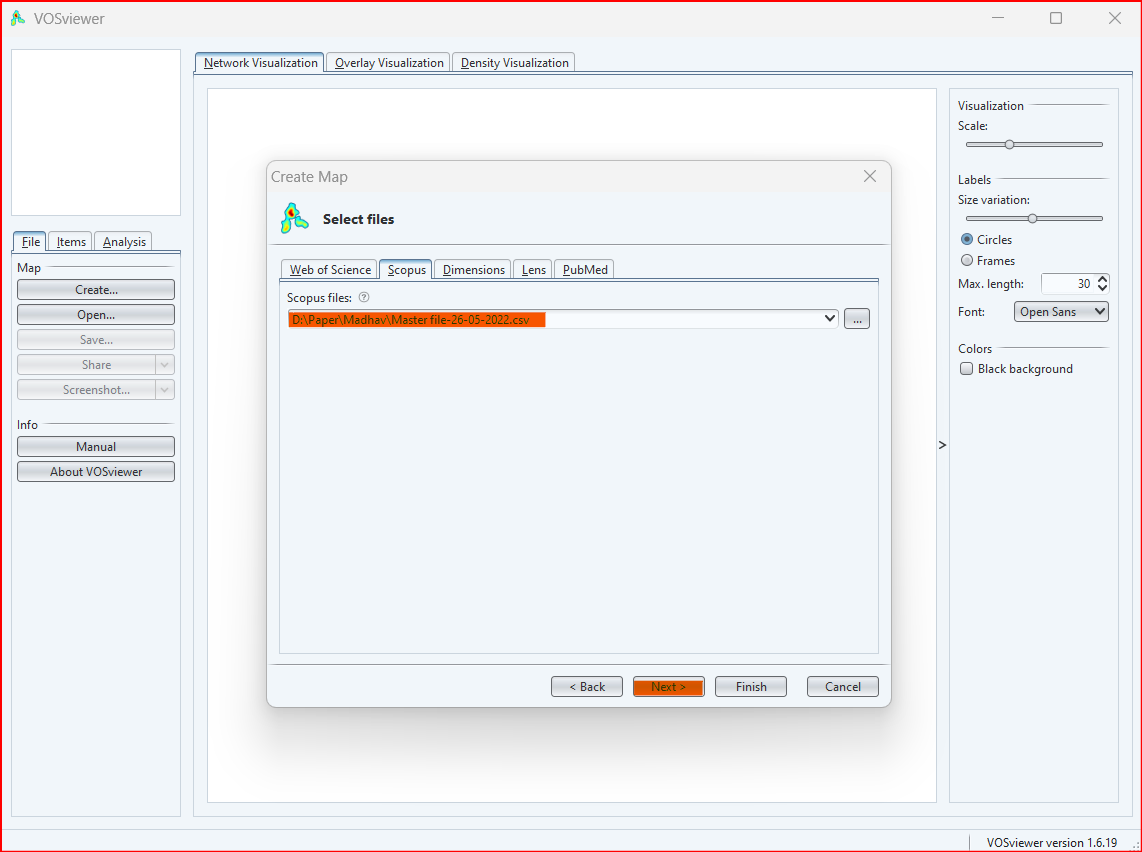
File format is supported in VOSviewer from the different bibliographical databases:-
- Web of Science: Plain Text or Tab-Delimited Format
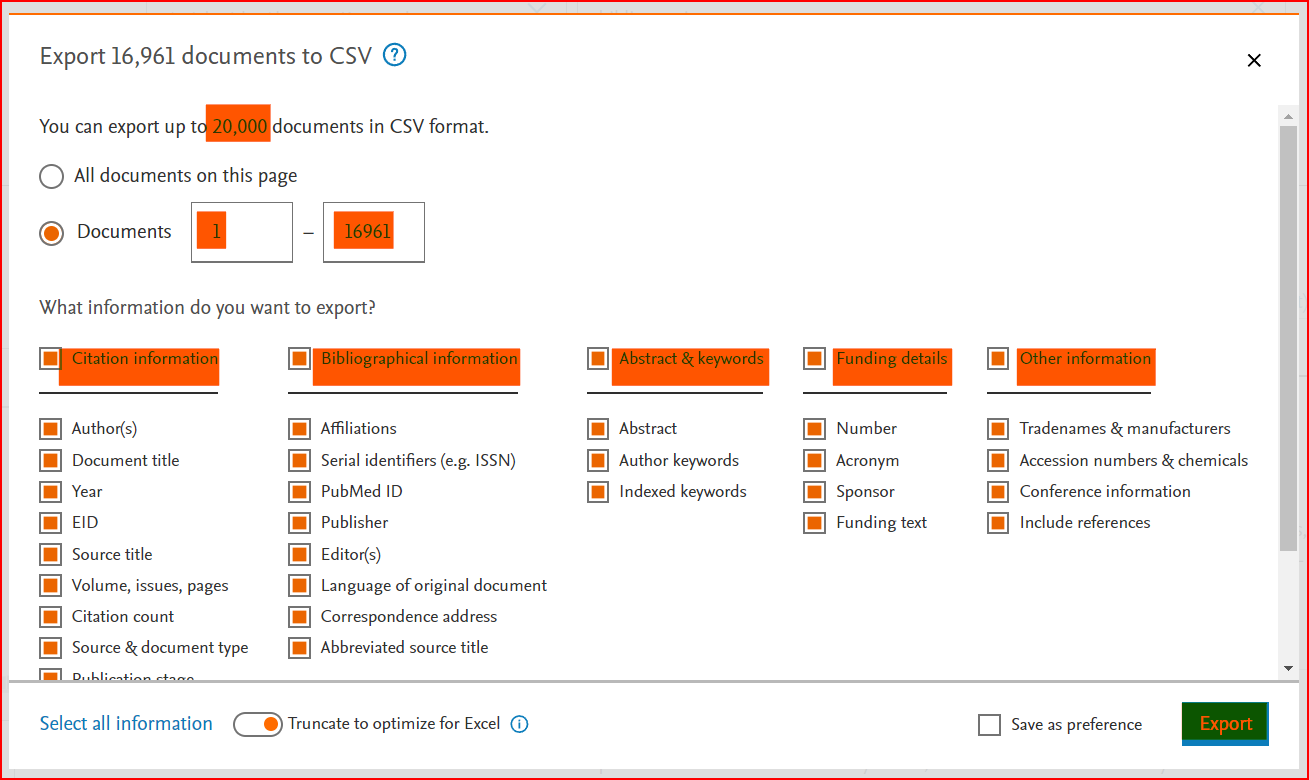
- Scopus: Comma-Separated Format
- Dimensions: Comma-Separated Format
- Lens: Comma-Separated Format
- PubMed: MEDLINE Format
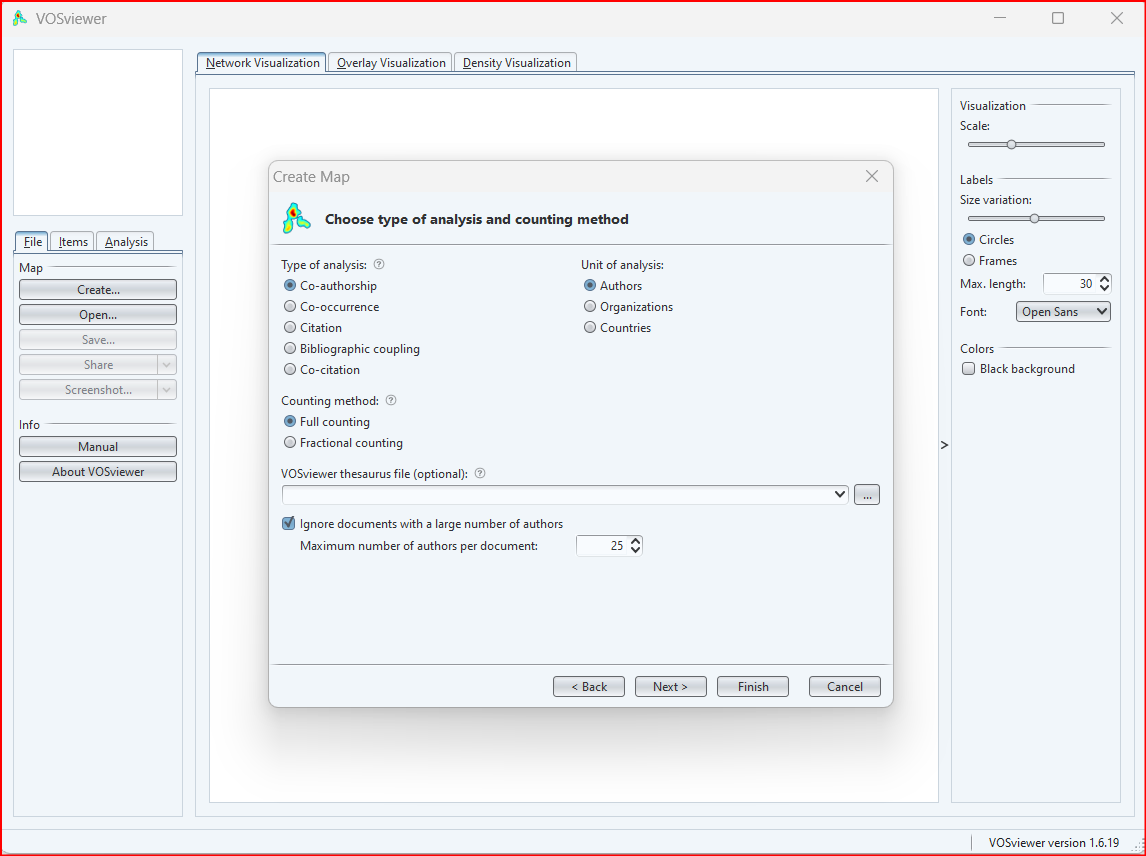
Choose the type of analysis, unit of analysis and counting methods
VOSviewer allow us to analysis the data in five ways:-
- Co-authorship analysis is often used to identify research collaborations and to track the evolution of research networks over time. It can be used to identify the most productive authors, organizations, and countries in a field, as well as to identify emerging research clusters.
- Co-occurrence analysis is often used to identify the main topics in a field and to track the evolution of topics over time. It can be used to identify the most important keywords in a field, as well as to identify emerging topics and trends.
- Citation analysis is often used to identify the most influential publications in a field and to track the impact of research. It can be used to identify the most cited publications, authors, organizations, and countries in a field, as well as to track the evolution of a field over time.
- Bibliographic coupling analysis is often used to identify publications that are related to each other, even if they do not cite each other directly. It can be used to identify groups of publications that are working on similar topics, as well as to identify emerging research areas.
- Co-citation analysis is often used to identify groups of publications that are related to each other in terms of their content. It can be used to identify the most influential research clusters in a field, as well as to track the evolution of research clusters over time.
It allows you to specify the minimum number of occurrences of a node or link in order for it to be included in the visualization. This can be useful for reducing the amount of clutter in the visualization, especially when dealing with large datasets.
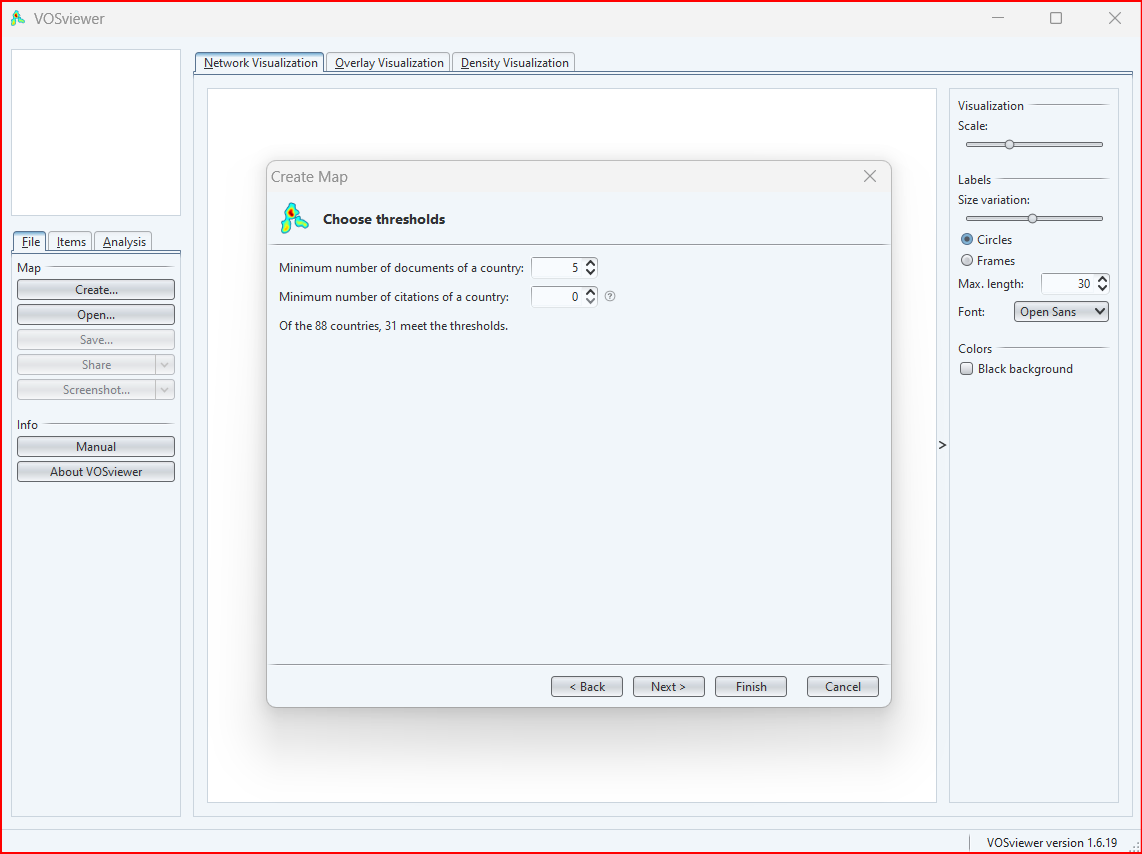
Here are some tips for choosing the thresholds:
Here are some tips for choosing the thresholds:
- If you are dealing with a large dataset, you may want to set the thresholds higher in order to reduce the amount of clutter in the visualization.
- If you are interested in identifying the most important nodes and links in the network, you may want to set the thresholds lower.
- You can also use the "density" slider to adjust the density of the visualization. A higher density will result in more nodes and links being included in the visualization, while a lower density will result in fewer nodes and links being included.
- If you are doing a co-authorship analysis, you could set the threshold for the minimum number of co-authors to 5. This would mean that only authors who have co-authored at least 5 papers with other authors would be included in the visualization.
- If you are doing a citation analysis, you could set the threshold for the minimum number of citations to 10. This would mean that only references that have been cited at least 10 times would be included in the visualization.
- If you are doing a keyword analysis, you could set the threshold for the minimum number of occurrences of a keyword to 5. This would mean that only keywords that occur at least 5 times in the dataset would be included in the visualization.
There are a few factors to consider when choosing the number of items to include:
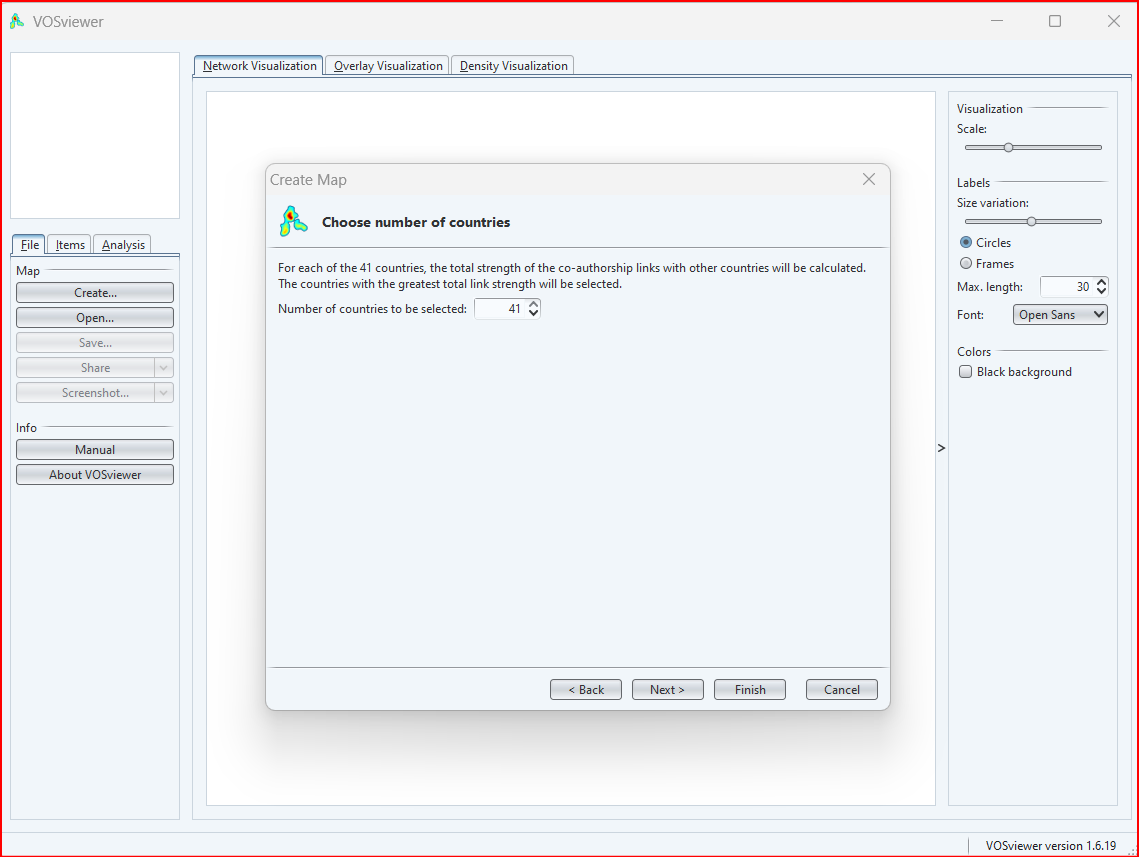
- The size of your network: If you have a large network, you may not be able to include all of the items on the map without the map becoming too cluttered.
- The level of detail that you want to show: If you are interested in seeing the relationships between all of the items in your network, you will need to choose a larger number of items to include on the map. However, if you are only interested in seeing the relationships between the most important items in your network, you can choose a smaller number of items to include on the map.
- The purpose of your analysis: If you are using VOSviewer to identify the most important items in your network, you will want to choose a larger number of items to include on the map. However, if you are using VOSviewer to identify emerging trends or clusters in your network, you may want to choose a smaller number of items to include on the map.
In this step, you review the list of items that you have chosen to include on your VOSviewer map. You can add or remove items from the list as needed.
Here are a few tips for verifying the selected items: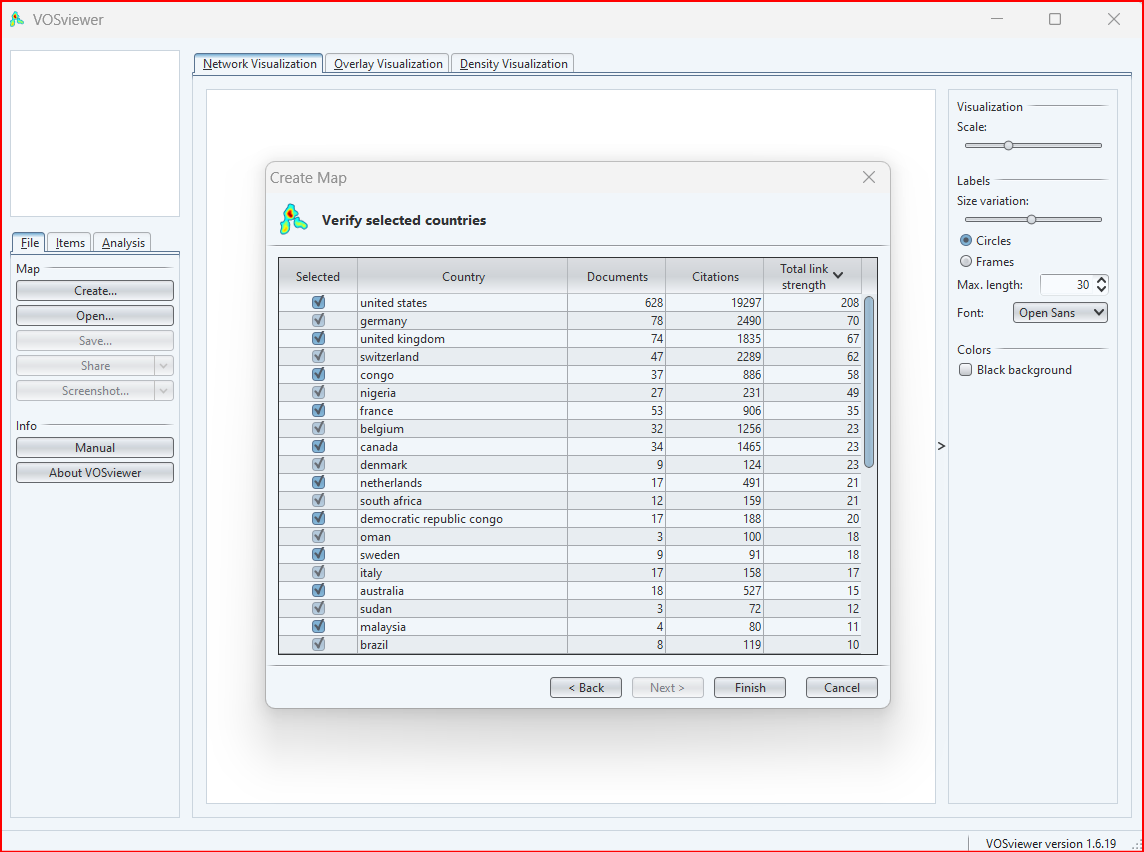
Here are a few tips for verifying the selected items:
- Make sure that the items are relevant to your research question.
- Make sure that the items are well-defined and unambiguous.
- Make sure that the items are spelled correctly.
- Once you have verified the selected items, you can create your VOSviewer map.
After step 7, now click on finish to create the map (visulization) of the selected items:
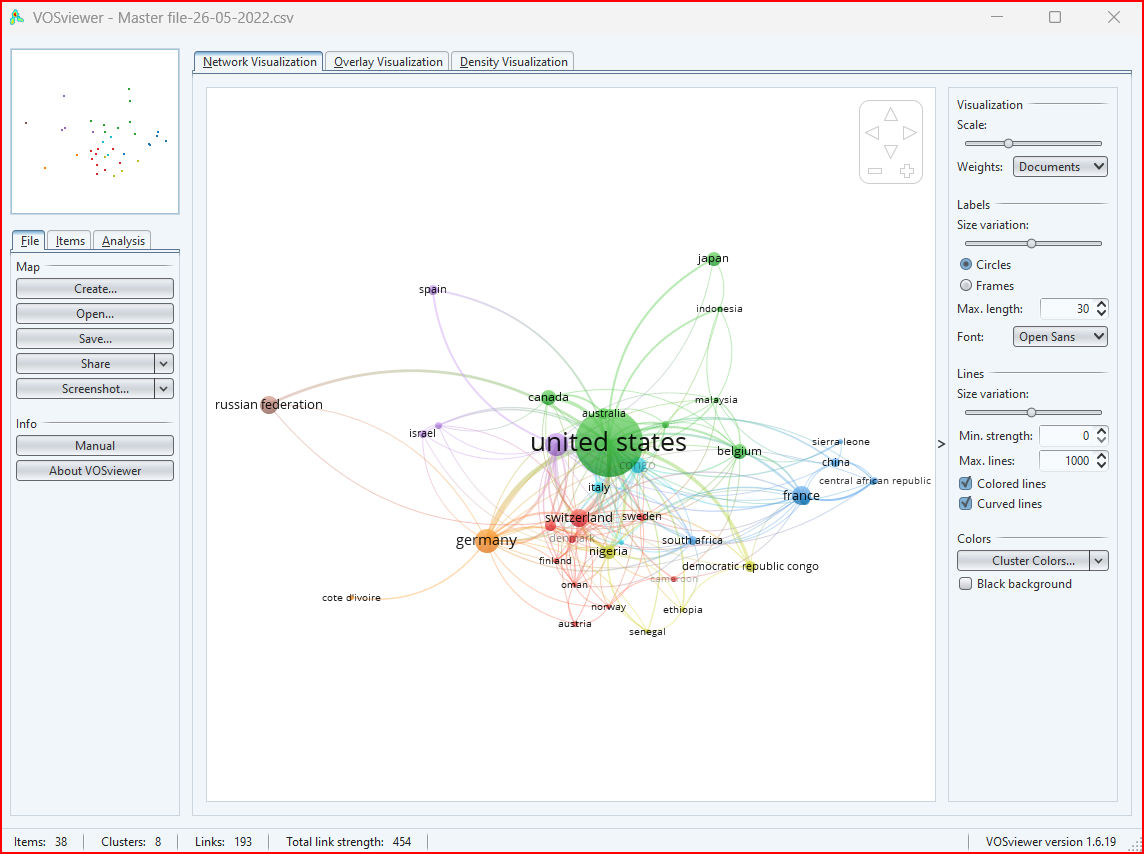
- Network visualization: This type of visualization shows the relationships between items in a network. The size of the nodes in the network represents the importance of the items, and the thickness of the edges represents the strength of the relationships between the items.
- Overlay visualization: This type of visualization allows you to overlay different types of data on top of each other. This can be useful for identifying relationships between different types of data. For example, you could overlay a keyword co-occurrence map on a co-authorship map to see which keywords are most popular among different groups of authors.
- Density visualization: This type of visualization shows the distribution of items in a network. This can be useful for identifying areas of the network where there is a high concentration of items. For example, you could use a density visualization to identify the most important clusters of items in a co-authorship map.
- Timeline visualization: This type of visualization shows how the relationships between items in a network have changed over time.
- Cluster visualization: This type of visualization shows the groups of items in a network that are related to each other.
- Keyword visualization: This type of visualization shows the most important keywords in a network.
Detailed note on the different types of analysis that VOSviewer provides, along with the units of analysis and counting methods:
Co-authorship analysis
Unit of analysis: Authors, Organizations, Countries
Counting methods: Full counting, Fractional counting
Co-authorship analysis identifies research collaborations and tracks the evolution of research networks over time. It can be used to identify the most productive authors, organisations, and countries in a field and to identify emerging research clusters.
Co-occurrence analysis
Unit of analysis: All keywords, Authors keywords, Index keywords
Counting methods: Full counting, Fractional counting
Co-occurrence analysis identifies the main topics in a field and tracks the evolution of topics over time. It can be used to identify the most important keywords in a field and to identify emerging topics and trends.
Citation analysis
Unit of analysis: Documents, Sources, Authors, Organizations, Countries
Counting methods: Full counting, Fractional counting
Citation analysis identifies the most influential publications in a field and tracks the impact of research. It can be used to identify the most cited publications, authors, organizations, and countries in a field, as well as to track the evolution of a field over time.
Bibliographic coupling analysis
Unit of analysis: Documents, Sources, Authors, Organizations, Countries
Counting methods: Full counting, Fractional counting
Bibliographic coupling analysis identifies publications that are related to each other, even if they do not cite each other directly. It can be used to identify groups of publications that are working on similar topics, as well as to identify emerging research areas.
Co-citation analysis
Unit of analysis: Cited references, Cited sources, Cited authors
Counting methods: Full counting, Fractional counting
Co-citation analysis identifies groups of publications that are related to each other in terms of their content. It can be used to identify the most influential research clusters in a field, as well as to track the evolution of research clusters over time.
Example:
Research question: What are the main research collaborations in the field of artificial intelligence?
Unit of analysis: Authors
Type of analysis: Co-authorship
This analysis would create a map of the relationships between authors in the field of artificial intelligence, based on the papers that they have co-authored. The size of the nodes on the map would represent the importance of the authors, and the thickness of the edges would represent the strength of the relationships between the authors.
Research question: What are the main research collaborations in artificial intelligence?
Unit of analysis: Authors
Type of analysis: Co-authorship
Example:
Research question: What are the main topics in artificial intelligence, and how have they evolved?
Unit of analysis: All keywords
Type of analysis: Co-occurrence
Example:
Research question: Which researchers in artificial intelligence have the most impact on the field?
Unit of analysis: Authors
Type of analysis: Citation
Example:
Research question: Which groups of publications in artificial intelligence are most related to each other in terms of their content?
Unit of analysis: Documents
Type of analysis: Co-citation
Unit of analysis: Authors
Type of analysis: Co-authorship
Example:
Research question: What are the main topics in artificial intelligence, and how have they evolved?
Unit of analysis: All keywords
Type of analysis: Co-occurrence
Example:
Research question: Which researchers in artificial intelligence have the most impact on the field?
Unit of analysis: Authors
Type of analysis: Citation
Example:
Research question: Which groups of publications in artificial intelligence are most related to each other in terms of their content?
Unit of analysis: Documents
Type of analysis: Co-citation
- Publication on VOSviewer
- Video
- Manual (1.6.19)